White Paper: Measuring Return on Marketing Investment for Community Banks

Click to download the Full White Paper for Community Banks.
The Relationship Between Community Bank Marketing Investments and Revenue Growth
Why This Study?
For decades, major brands have understood the relationship between marketing investments and the growth of their brands. They measure growth in tenths of market share points and have a clear idea of marketing investment ROI. Why such focus and pursuit of market share? They understand that market share is the market’s judgement of the value of their brand. They understand the relationship between increases in market share to increases in revenues and profitability – and to long-term growth and sustainability. They have a clear picture of the ROI of marketing campaigns. So, why are community and regional banks so far behind other industries when it comes to investing in marketing and understanding the impact of marketing on growing their revenues and their share?
Executives surely understand the major reasons for investing in marketing: to build brand awareness, to differentiate themselves from competitors, and to communicate their mission in a way that builds their culture and attracts the respect and admiration of their clients and prospects. But, having worked with many bank executives over the last forty years, the main reason for holding back their investments in marketing is very simple: they struggle with accurately measuring return on marketing investment.
Most have not connected the dots between their marketing programs and the impact on their balance sheets. Calculating marketing ROI is critical to optimizing marketing spend.
In 2019, in collaboration with Marc Winkler, a community bank veteran, Princeton Partners set out to understand the relationship between marketing investments and revenue growth at community banks. Based on our work with community banks, and also other industries such healthcare, higher education and consumer services and retail, we knew at a high level that there was a direct, positive correlation between marketing investments and revenue growth. We observed ROI of marketing campaigns in the forms of increases in product sales and geographic market share. But the research in this area, especially for measuring ROI in marketing for community financial institutions was lacking. So, we set out to conduct our own studies that clearly revealed the relationship between marketing investments, and the consistency of those investments, and accelerated revenue growth.
Our community bank marketing investment ROI findings provide the basis for community banks to seriously examine the power and potential of marketing investments to accelerate revenue growth, which is critical to maintaining their franchise, increasing market share, and creating sustainable value. This white paper will summarize three of our proprietary studies that, by measuring marketing return on investment for community and regional banks, all demonstrate the clear relationship between marketing investments (both level and consistency) and revenue growth. These relationships hold across different asset tiers and can help bank executives to see how they compare to the median marketing investment ratio and to competitors in the top performing quintiles.

EXECUTIVE SUMMARY
The Problem
Partly due to misunderstanding of marketing investment ROI, community banks as a whole tend to underinvest in marketing and are falling behind national banks, disrupter banks, digital-only banks, and non-banks who are investing heavily to capture existing consumers, including younger generations, through branded digital marketing. An ABA survey reported that digital ad spending in the banking industry will have nearly doubled from $8.6 billion in 2021 to $16.6 in 2024. Those institutions who are not advancing along this trajectory with strategic investments in their brand marketing will fall behind quickly and risk losing their franchises especially with digital-first Generation Z and Generation Alpha.
The Opportunity
Community banks can understand how their marketing investments compare to their peers in their asset class and begin to strategize ways to work toward the right level of marketing investments to achieve their longer-term business growth goals. Accurately calculating marketing ROI is the foundation.
Key Finding and Insights
- There is a positive correlation between marketing investments as a percent of assets and revenue growth as a percent of assets in all community bank asset tiers. Community bank marketing return on investment is clearer than it may appear.
- Banks that invest consistently YOY with some average incremental growth in marketing investments, are shown to grow revenues at about twice the rate of those that, on average, have declining YOY marketing investments as a percentage of assets.
Opportunities and Actions to Consider
Measure your marketing investments as a percent of assets over the last five years to correlate marketing to revenue growth and determine your own marketing investment ROI.
Create a custom peer group of key competitors in your markets to measure and compare your ROI of marketing campaigns to theirs.
- Evaluate the components of your marketing program investments and develop pro-forma scenarios of sensible future marketing investments that are required to support your growth goals such as growth in deposits acquired and growth in revenues.
STUDY 1: 166 Banks (2015-2018)
Hypothesis
There is a correlation between community bank marketing investments and key performance metrics such as revenue growth and asset growth.
Methodology
We started with a Q4, 2019 survey by the Financial Brand of bank marketing budgets for the 2015-2018 period. We organized the budgets into quartiles of marketing expenditure levels across three asset categories: banks with less than $500 million, those with $500 million to $1 billion, and those with $1 billion to $5 billion. We then independently sourced revenue information for each bank from the FFIEC database with a total of 166 banks comprising the sample. We defined revenue as net interest income plus non-interest income. In measuring return on marketing investment, we chose to look at revenue rather than net income since marketing’s objective is to generate new profitable business and to eliminate any effects of expenses (provision for loan losses and operating expenses).
Findings
Conclusions
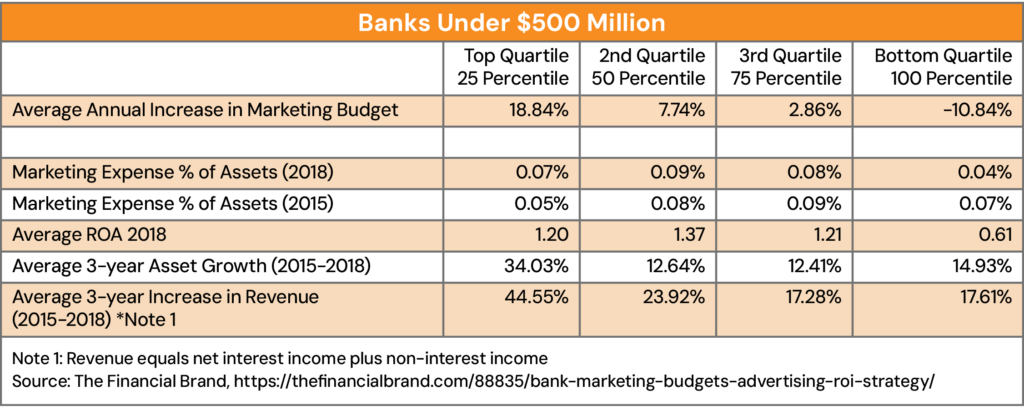
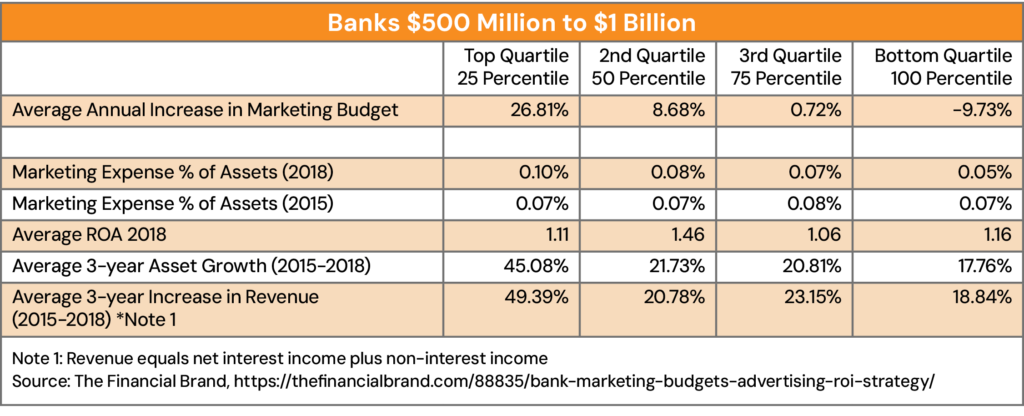
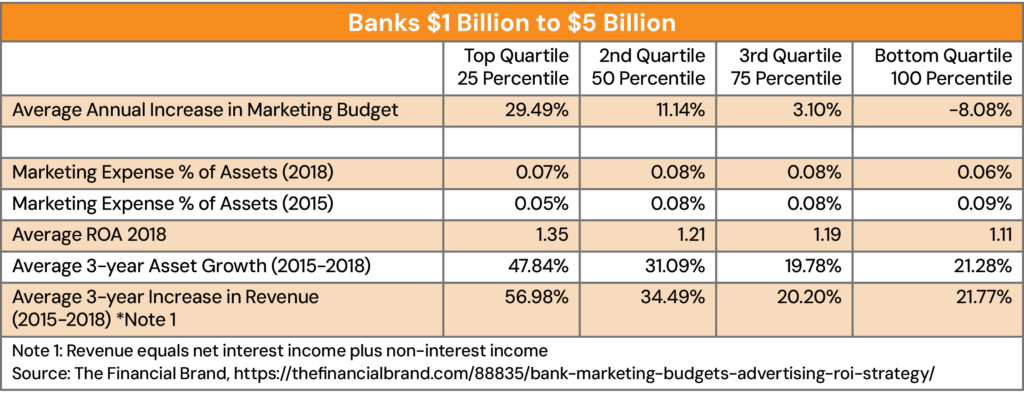
Banks that increased their marketing budgets the most over a three-year time span, also had the highest growth rates in both assets and revenue. This marketing return on investment held true in all three asset categories that were analyzed.
- The top quartile (25 percentile) for banks $1 billion to $5 billion averaged an increase of 29.49% annually in marketing budgets over three years. The three-year average growth for assets and revenue for this quartile were 47.84% and 56.98%, respectively.
- The second quartile had an average three-year annual growth rate in marketing budgets of 11.14% with assets and revenue increasing at 31.09% and 34.48%, respectively.
- The growth rate in assets and revenues dropped significantly where the increase in the marketing budgets were only 3.1% and minus 8.08% respectively, in the bottom two quartiles. Available data suggests the ROI of marketing campaigns increases with marketing spend.
- We also see that the Marketing Investment Impact Threshold was 7 basis points in three of the four quartiles and 8 basis points in the fourth.
Although there are some variations for all three asset categories, the foundation for increasing marketing investment ROI is clear. Banks who increase their marketing budgets every year generate more rapid asset growth with corresponding increases in revenue. We can conclude that meaningful annual increases of 10% or more in the budget drives sufficient growth and more than compensates for the increased marketing expenditures. We could also postulate that institutions that have made a strategic choice to increase asset and revenue growth at a faster rate have also made the logical decision to invest more in their annual marketing budgets to achieve these growth rates and business goals. Essentially, they were strategically aligning their marketing plan with their business objectives. These choices enabled their marketing return on investment to scale with their business.
STUDY 2: 2,291 Banks (2015-2019)
Hypothesis
When predicting or calculating marketing ROI, there is a correlation between marketing investments as a percentage of assets and revenues as a percent of assets.
Methodology
We gathered FDIC-reported data through BankRegData.com Metrics: CAGR (Compound Annual Growth Rate) – calculated between 2015 and 2019.
- 2291 Institutions: Average values calculated for five years: 2015 through 2019
- Revenue = Interest Income – Interest Expenses + Non Int Income
- Revenue Ratio = Annual Revenue/Total Assets
- Marketing Ratio = Annual Adv.-Marketing Expenses/Total Assets
- 2,291 Banks who reported marketing expenses in all five years comprised the study sample
- Marketing expense data was grouped based on 5-Year Average Annual Assets
- Pearson Coefficients were used to calculate the statistical relationship between the two variables: Revenue Ratio Annual Revenue/Total Assets) and Marketing Ratio (Annual Marketing Expenses/Total Assets).
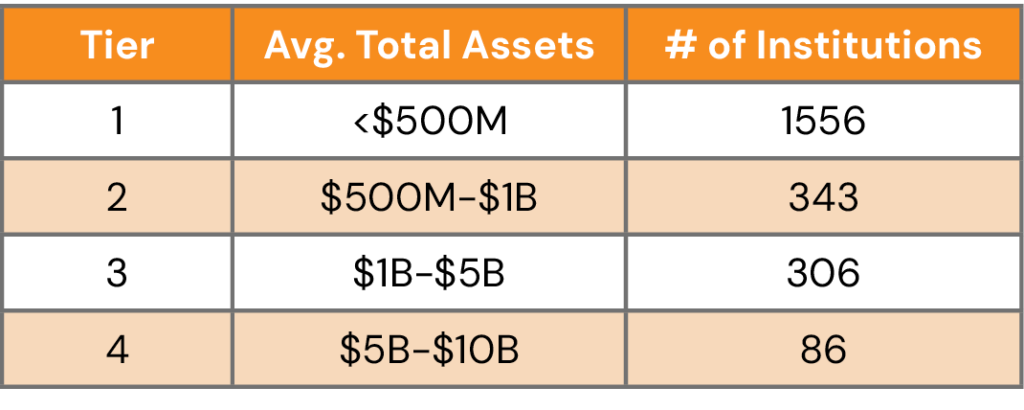
Quartiles: Grouped based on 5-Year Average Annual Ratio of Marketing Expenses to Assets
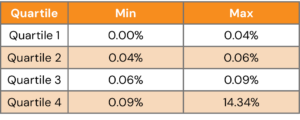
Findings
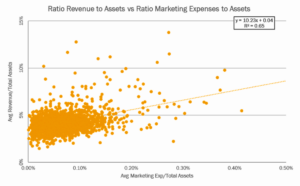
- All 2,291 Banks – In quartiles 3 and 4 (above the median marketing investment), the Pearson Coefficient was 0.65 indicating a strong positive marketing and ROI relationship between the Revenue/Asset ratio and the Marketing/Asset ratio.
- The slope value was 10.23 indicating an incremental 10.23 points in the value of the ratio of Average Revenue to Total Asset by incrementing 1 point in the value of the ratio of Marketing Expenses to Assets. It can be stated that above the median level of marketing investments (Quartiles 3 and 4), that an incremental investment of $1 correlates with incremental revenue of $10.23.
- Tiers 1, 3 and 4 also showed a strong positive relationship between the Revenue/Asset ratio and the Marketing/Asset ratio where the spending was above the median (Quartiles 3 and 4).
- Tier 2 showed a medium to strong positive relationship between the Revenue/Asset ratio and the Marketing/Asset ratio where the spending was above the median (Quartiles 3 and 4).
ALL 2,291 BANKS: Strong Positive Relationship Between Revenue/Assets and Marketing Expenses/Assets
Tier 1: 1556 Institutions with Less Than $500 Million in Assets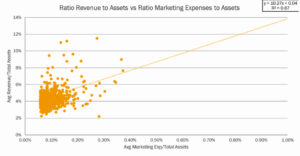 Quartiles 3 & 4: The Pearson Coefficient was 0.67 indicating a strong positive relationship between the Revenue / Asset ratio and the Marketing / Asset ratio.
Tier 2: 343 Institutions with $500 Million to $1 Billion in Assets
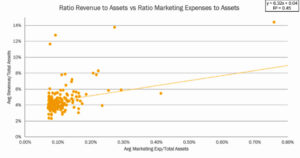 Quartiles 3 & 4: The Pearson Coefficient was 0.45 indicating a medium to strong positive relationship between the Revenue/Asset ratio and the Marketing/Asset ratio. (0.50 is considered a strong, positive relationship).
Tier 3: 306 Institutions with $1 Billion to $5 Billion in Assets
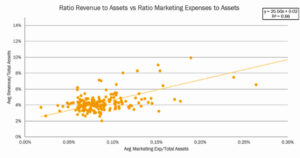
Quartiles 3 & 4: The Pearson Coefficient was 0.66 indicating a strong positive relationship between the Revenue/Asset ratio and the Marketing/Asset ratio.
Tier 4: 68 Institutions with $5 Billion to $10 Billion in Assets
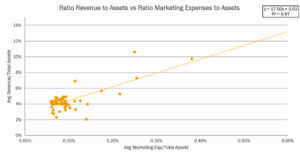 Quartiles 3 & 4: The Pearson Coefficient was 0.87 indicating a strong positive relationship between the Revenue/Asset ratio and the Marketing/Asset ratio.
Conclusions
- All four asset tiers demonstrated a strong (or medium-strong for Tier 2) relationship between the Revenue/Asset ratio and the Marketing/Asset Ratio.
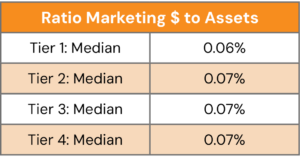
- The Median of the Ratio of Marketing to Assets was 6 basis points for tier 1 and 7 basis points for tiers 2, 3 and 4. (In Study 1, the top two quartiles of higher-growth banks revealed a minimum of 7 basis points, up to 10 basis points, as an indicator of the level that banks with a growth orientation would want to minimally meet to maximize their marketing investment ROI.)
STUDY 3: 1,402 Banks (2015-2023)
Hypothesis
Banks that consistently invest in marketing year over year grow revenue faster, seeing a more significant increase in marketing investment ROI, than those that don’t.
Methodology
We gathered FDIC-reported data through BankRegData.com Metrics: CAGR (Compound Annual
Growth Rate) – based on year-end reports for the years 2015 through 2023. We then grouped 4,503 Community banks with assets up to $25 Billion into four asset tiers.
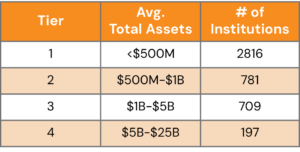
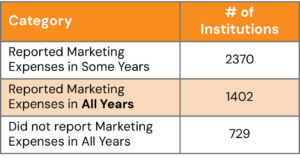
We then scraped their reported marketing expenses and eliminated those that did not report marketing expenses in all nine annual periods, leaving 1,402 banks for analysis.
Findings
We examined the marketing investment behaviors of those 1,404 banks and found:
- 1,204 banks demonstrated average growth in their year-over-year marketing investment.
- 200 banks demonstrated average year-over-year decline in their marketing investments.
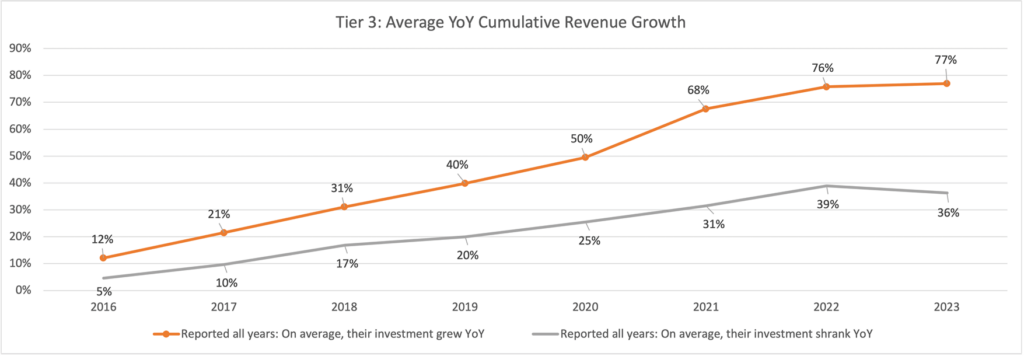
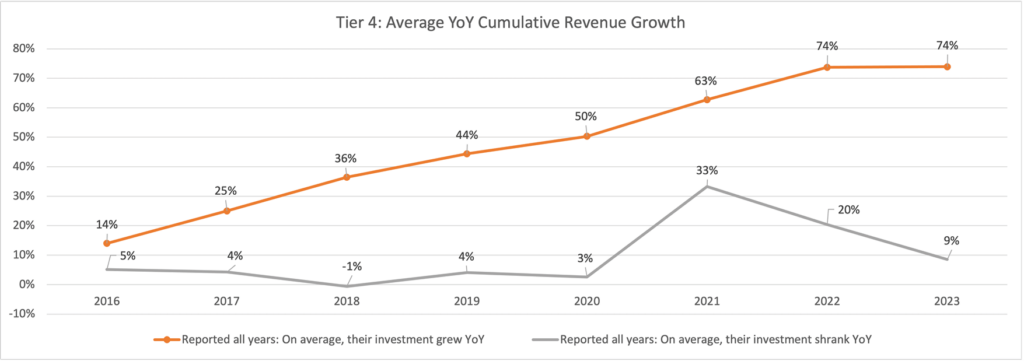
- In measuring return on marketing investment year over year, we found that the 1,204 banks committed to investing in marketing grew at about twice the rate of the 200 that were not committed. This difference in marketing investment ROI held true in all four tiers.
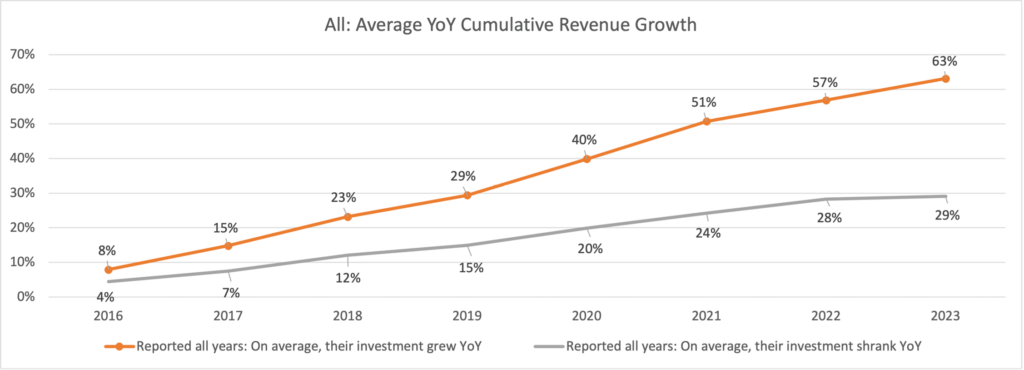
Tier 1: 2,816 banks with < $500m
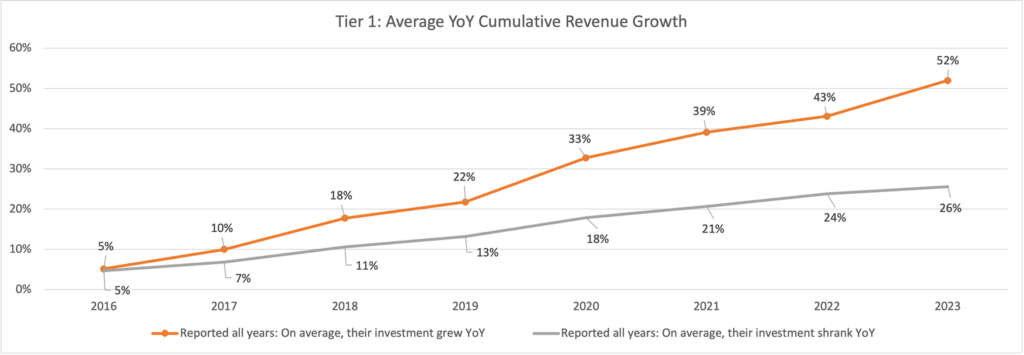
Tier 2: 781 banks with < $500m – $1b in assets
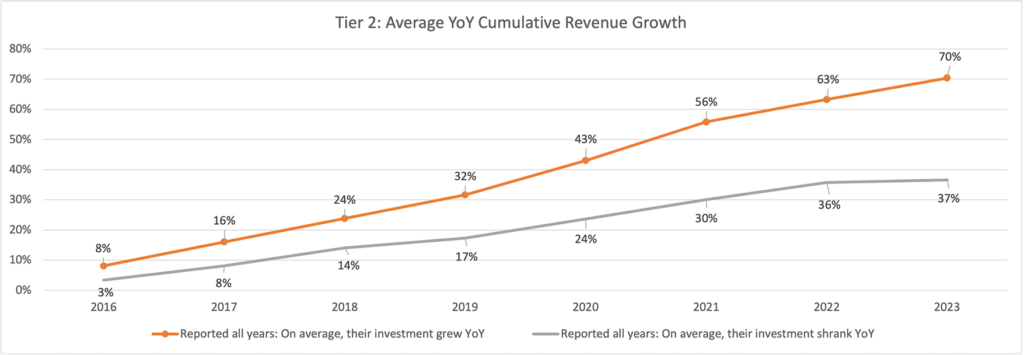
Tier 3: 709 banks with $1b – 5b in assets
Tier 4: 197 banks with $5b – 25b in assets
SUMMARY
All three of our studies measuring ROI in marketing for community and regional banks demonstrate a positive relationship between marketing investments and revenue growth. The marketing investment ROI results are consistent across asset tiers. There are two key factors that support the impact of marketing investments on revenue growth:
- The Level of Marketing Investments – In study one, the top two growth quartiles in all asset tiers demonstrated that a marketing investment level of at least 7 to 10 basis points supports higher revenue growth rates than peers. In study two examining 2,291 banks, three asset tiers demonstrated a strong positive relationship between the Revenue/Asset ratio and the Marketing/Asset ratio where the spending was above the median (Quartiles 3 and 4). The fourth asset tier showed a medium to strong correlation. The level of investment correlating to growth was at least 6 to 9 basis points as a percent of assets. In calculating marketing ROI, the data indicates that more spend leads to more growth.
- The Consistency of Marketing Investments – Study one demonstrated the importance of consistency of commitment via the growth of marketing investments over the study period in order to impact higher levels of revenue growth. Study three dramatically portrays the importance of commitment to marketing investments as part
of a successful strategy. Those banks that reported higher YOY increases in marketing investments experienced about double the growth in average annual revenues that their uncommitted peers. YOY growth of marketing investment ROI is tied to increases in marketing spend over time.
Limitations of the Studies
The marketing expenditure levels reported in FDIC Call Reports only report total spending. We do not have data to show how marketing investments were categorized. Anecdotal information suggests that marketing investments include a wide range of activities including marketing research, customer experience investments in websites, advertising media, content, social media, events, sponsorships and even donations. New research would be useful to identify how marketing investments were applied specifically to various business goals such as growing new money via new customer deposit acquisition or increasing the number and quality of new loans generated in the pipeline and new loans closed. Quantifying digital marketing return on investment would be especially useful.
What Else Should Bank Executives Be Thinking About?
- Do you have the marketing knowledge and leadership to plan for, implement, measure, and improve the performance of your marketing investments?
- Are you improving your ability to measure, report, and correlate specific marketing investments to business outcomes for a more granular and actionable understanding of your marketing investment ROI?
- Are you developing and improving marketing outcomes reports and dashboards and connecting those insights to financial outcomes on your balance sheet?
- If your marketing investment to asset ratio is below 7 basis points, where can you find efficiencies elsewhere in the organization to make informed, strategic investments in marketing?
- Do you have a written strategic marketing plan that prioritizes where marketing initiatives can have the greatest impact on organizational goals?
Click to download the Full White Paper for Community Banks.
Princeton Partners is dedicated to Community Bank Success. Learn more at our Financial Services page.
Acknowledgement – Special thanks to Marc Winkler, a 35-year, C-level banking executive who led the research for the first study, and elevated Princeton Partners’ knowledge of the banking industry from the perspective of a CEO, CFO, and CRO.


